Friday, June 29, 2007


20070629 1041 ET. Soybeans open limit up, but Corn gaps down slightly. Long on 2 blue bars provides a quick entry into a profitable position. The limit up on Soybeans creates a 'pull' on the other grain markets.

Wednesday, June 27, 2007


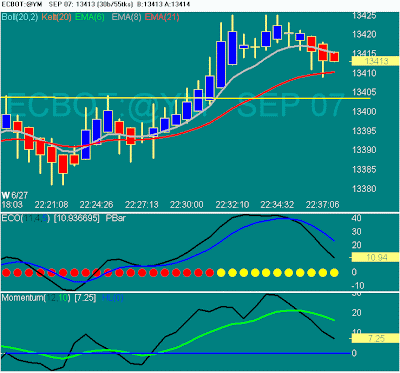
20070627 1130 ET. Dec corn moves down nicely to 363 1/2. Trading this breakout on a day of range in the equity indices (FOMC) can bear fruit.


20070627 1116 ET. A nice short in the Agricultural corn contract, ZC on the ecbot at 370 3/4, on the break of the low of the first 30 min range on the floor session. A nice setup for the 4 tick, 8 tick T1 and T2 targets. Remainder of 1/3 position is exit at discretion, to try to milk the trend.


20070627 1037. 2 minutes was all this trade lasted, with the emergence of 2 consecutive red bars, closed out for small profit.


20070627 1035. 13404-9 area provides the entry level for the mini Dow futures breakout trade today. FOMC meets later in the afternoon, so breakouts could be limited to small moves today.

Tuesday, June 26, 2007


20070626 1040. Buy signal on YM, on the break of the 70-75 area, with the needed lowvolatility region breakout and resistance level break.

Monday, June 25, 2007


20070625 1025. YM reaches 13580, loss of momentum from the indicators indicate time to close the position.


20070625 1005. YM gets to 13575. DMI provides the 'bull stance' to support this trade.


20070625 1059. Buy fires off on the mini Dow futures at 13538-43. Red dot zone, break of previous high provide the fuel.

Thursday, June 21, 2007


20070621 1139. YM short set up, but was not a clean break. Had to dally around the entry level 13586-89 before moving down. Let's see how this oue, which initially stalled goes.


20070621 1031. Mini Dow buy signal fires off at 13549-55 region. Breakout of previous high resistance, formed by movement of 'thrust' candles out of low volatility region (red dots)

Wednesday, June 20, 2007


20070620 1050. 2 red candles, and the position is closed out at 70. Objective signals are the must have in trading, removing the human element, which will surely in the end screw up the trade.


20070620 1036. 13748-50 is the region of the breakout of the previous swing high resistance, coming out of the red dot (low volatility) area. Long with 10 point stop. First target 10 points then discretion on 2nd 1/2.

Tuesday, June 19, 2007


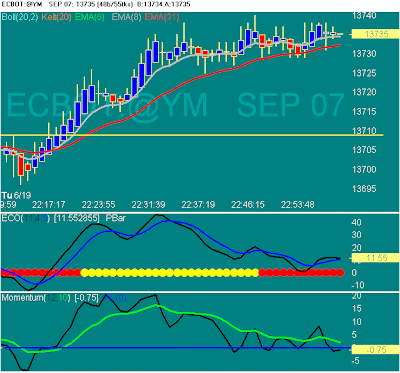
20070619 1101. YM trend continues to high of 13740. At this point some profits should be locked in, with break even stop to ride any remaining trend.


20070619 1032 ET. A long squeeze (movement out of red dot zone) along with break of resistance of previous highs, indicating a long signal on the mini Dow YM futures contract at 13710.

Wednesday, June 13, 2007


20070613 Nov Soybeans (bottom chart) broke out at 53 3/4 with follow through. The 30 min breakout is worth exploring as a trading strategy, relatively smooth for today for this CBOT Agricultural futures product. Corn, Wheat and Soybean Oil futures are shown as well.

Tuesday, June 12, 2007


20070612 1121 ET. Trading is not confined to stock indices on ECBOT. Here is a 5 min Soybeans electronic chart. Going with the breakout of the first 30 minutes trading is a technique I heard one trader uses with great effect. The trick he says is to peel out of the position at 1 cent intervals (4 ticks) to lock in gains.


20070612 1115 ET. These sort of trading, need to be managed on a 'peeling off' basis. A quick 20 point move in the mini Dow should mean locking in profit on 1/2 of the position, with a break even stop trailed after that. Unexpected reversals then can be more psychologically dealt with.


20070612 1103. A short signal fires off on the YM at 13462. Market looks weak. Monday yesterday showed noticable absence of Merger Mania Monday, which is bearish for equities.

Wednesday, June 06, 2007


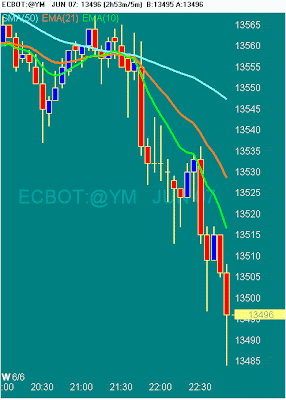
20070606 1053 ET. Mini Dow falls almost 1%. Some nice OBV indications.